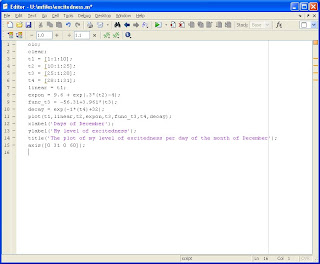
I was bored in class this morning so I decided to doodle. I found myself drawing random things and one of them was a set of axis. Then I decided to put time on the independent axis and mood on the dependent axis. I found myself making a plot of how excited I get about holidays with respect to time. I have an hour in between classes, So I thought I would be a huge nerd and plot it as a piecewise function, in MATLAB. The code is below if you are interested. It's very simple, I just needed to find the right eqautions.
Enjoy!


1 comment:
ok, that is really cool. how can i utilise that program?
i`m really not htat computer literate, so type slow.....
Post a Comment